Activity Diagrams
Activity diagrams are essentially flowcharts showing flow from activity
to activity. Activity diagrams model sequntial steps in a computational
process. Activity diagrams may stand alone to visualize the dynamics of
a society of objects, or they may be used to model the flow control of
an operation, or use case.
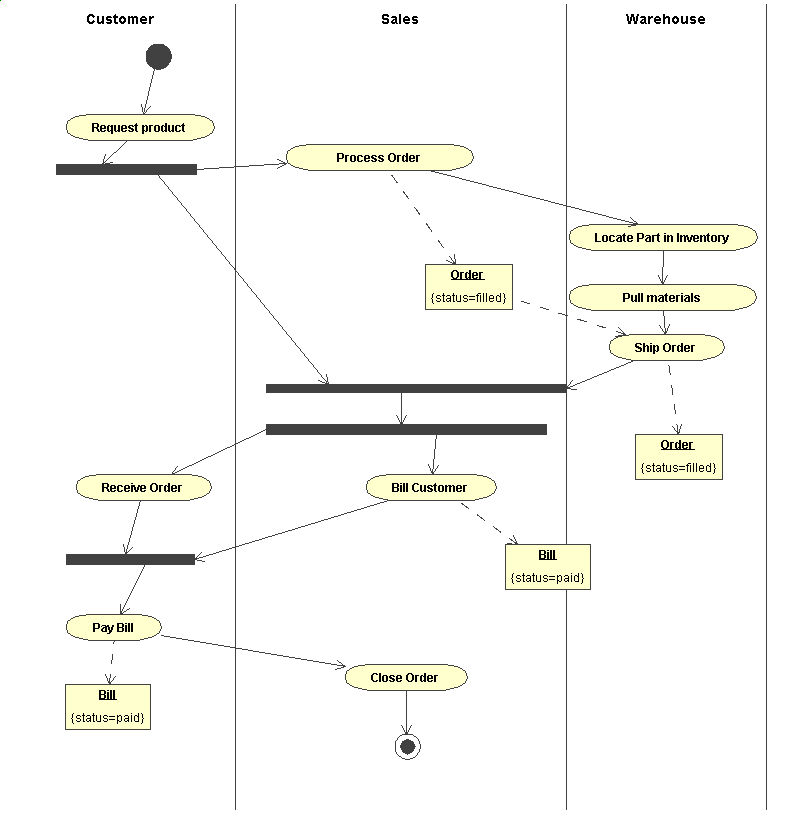
Figure 1 Shows an example activity diagram detailing a customer ordering
a product. There are several activities denoted by the oval shapes. This
activity diagram also tracks the transition of two objects through the
activity -- Order and Bill.
Figure 1 - Example Activity Diagram